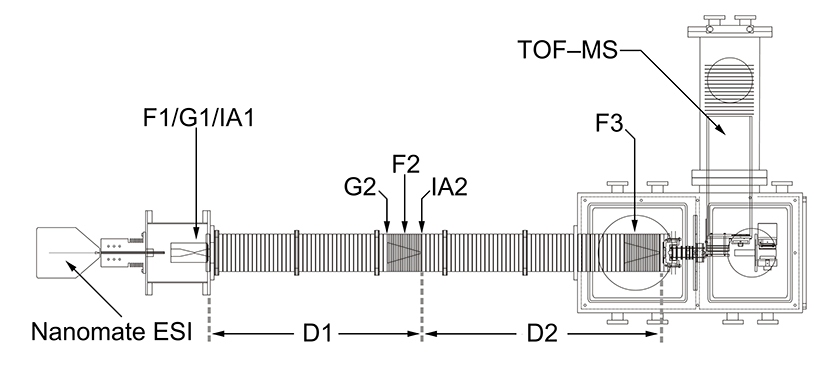
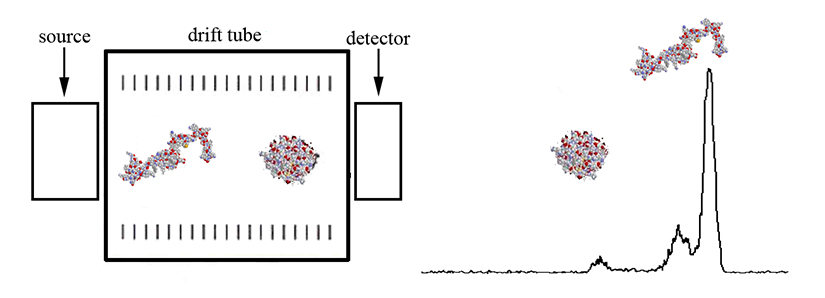
To initiate a mobility experiment, ions are introduced into a region ("drift tube", D1 and D2) across which an electric field is uniformly applied. The uniform field is typically achieved by connecting a series of evenly spaced rings (separated and isolated by a nonconducting material) with a chain of equal value resistors. The ions travel through the drift tube under the influence of the field, colliding with the buffer gas (typically inert gasses such as He, and N2, or air, depending on the application). The time required for the ions to reach the detector depends upon the ion's collision cross section (averaged over all possible orientations of the ion), charge state, and the drift tube operating parameters (electric field strength, drift tube length, and the buffer gas pressure, temperature, and mass). More compact ions traverse the drift tube more quickly than elongated ions (for a given mass and charge state).

Although only a brief explanation of the experimental procedure is included here, a more detailed description has been reported previously. Ions are first generated by posititive electrospray ionization. These ions are then collected and focused in a Smith-geometry hourglass ion funnel (F1, see references below for more information) prior to being pulsed into the drift tube through the use of an electrostatic gate (G1). The ~2 m drift tube (D1–D2) is filled with He buffer gas at 300 K and operated with a uniform electric field, such that the ions separate based upon their individual mobilities. A second electrostatic ion funnel (F2) located in the middle of the drift tube radially focuses the diffuse ion packet as it travels through the drift tube. After further mobility separation in D2, the ions are radially focused again by a third ion funnel (F3) prior to exiting the drift tube. Upon exit, the ions pass through a small differentially-pumped region and are then orthogonally accelerated into a field-free time-of-flight (TOF) mass analyzer.

The mobility of a gas phase ion depends on its collision cross section and charge state. Highly charged ions will experience a greater drift force than singly charged ions, thus having shorter drift times. For ions of the same charge state (and similar mass), compact ion conformations will have shorter drift times than extended conformations. Collision cross sections can be calculated to assist in structure determinations. These fundamental principals are illustrated in Figure 2 shown above, and Figure 3 as shown below.

The mobility of an ion as it travels through a drift tube can be described by Equation 1 shown below, where K is the mobility of the ion, L is the length of the drift tube, tD is the time the ion requires to reach the detector, and E is the strength of the electric field. When using standard units, the mobility K is expressed as cm2⋅V–1⋅s–1.

As mobilities are highly dependent on experimental parameters, reduced mobilities (K0) are often reported so that differences in the pressure and temperature of the buffer gas may be accounted for. As illustrated in Equation 2, where P and T are the pressure (in Torr) and temperature (in Kelvin) of the buffer gas, respectively, the reduced mobility involves a normalization of experimental parameters in order to provide a basis for comparison of experimental results.

Reduced mobility can be related to collisional cross-section through Equation 3 shown below. Here, ze is the charge on the ion, kb is the Boltzmann constant, and T is the temperature (in Kelvin). The reduced mass of the ion and the buffer gas must also be consider, where mI represents the mass of the ion of interest and mB represents the mass of the buffer gas. The final variables are the neutral number density of the buffer gas, N, and the cross-section of the ion itself, Ω.

Combining Equations 2 and 3 and solving for the collisional cross-section of the ion (Ω) allows us to directly relate the collision cross-section of the ion of interest to experimentally determined variables. It is also instructive to note that from these equations we observe that the mobility of the ion (K) is directly proportional to the charge on the ion, and inversely proportional to the cross-section of the ion. Furthermore, it is also noted that mass of the ion itself has very little influence on the mobility, such that the observed differences in mobility between bradykinin and ubiquitin are a result of the vast differences in charge state and collisional cross-section, rather than differences in molecular mass.

To obtain structural information from cross section measurements, cross sections can be calculated for trial conformers generated by various molecular modeling methods and compared with experimentally-obtained values. As mentioned above, the collision cross section gives an orientationally averaged result. The first approximation to the collision integral for an ion colliding with hard sphere buffer gas atoms is called the "projection approximation". This approach essentially finds the average "shadow" (Figure 4, below) as a trial conformer is rotated through all possible orientations.

Although the projection approximation is fairly quick, it is often only used as an initial estimate of the calculated cross-section of the theoetical conformation. In its place, a more accurate, but signficantly more computationally intensive method known as the trajectory method is used. It is instructive to explain here that the trajectory method treats the ion itself as a collection of atoms, each of which is represented by a Leonard-Jones (12–6–4) potential. These individual potentials are then summed in order to obtain the effective potential of the ion, which is then used to determine the scattering angle (∠Θ = incoming trajectory – outgoing trajectory) of the incoming buffer gas atoms. The orientationally-averaged collisional cross-section is then determined by integrating over all possible collision geometries. More information about these and other computational methods can be found through the Jarrold Group, as well as the following references.